This idea began as a question I’d been sitting on since I built the ADRH Mapper: what would A Coruña’s inequality map look like if you dropped it on New York?
The Instituto Nacional de Estadística, Spain’s agency responsible for collecting statistics, demographics, and the economy, publishes a Gini coefficient for every census section in the country. However, notable is that their income data is built from tax records. The US Census Bureau, the United States’ equivalent, is tasked with similar responsibilities, but builds its number from a voluntary survey instead. Both countries hand you a number, they’re sourced very differently.
What a Gini coefficient is
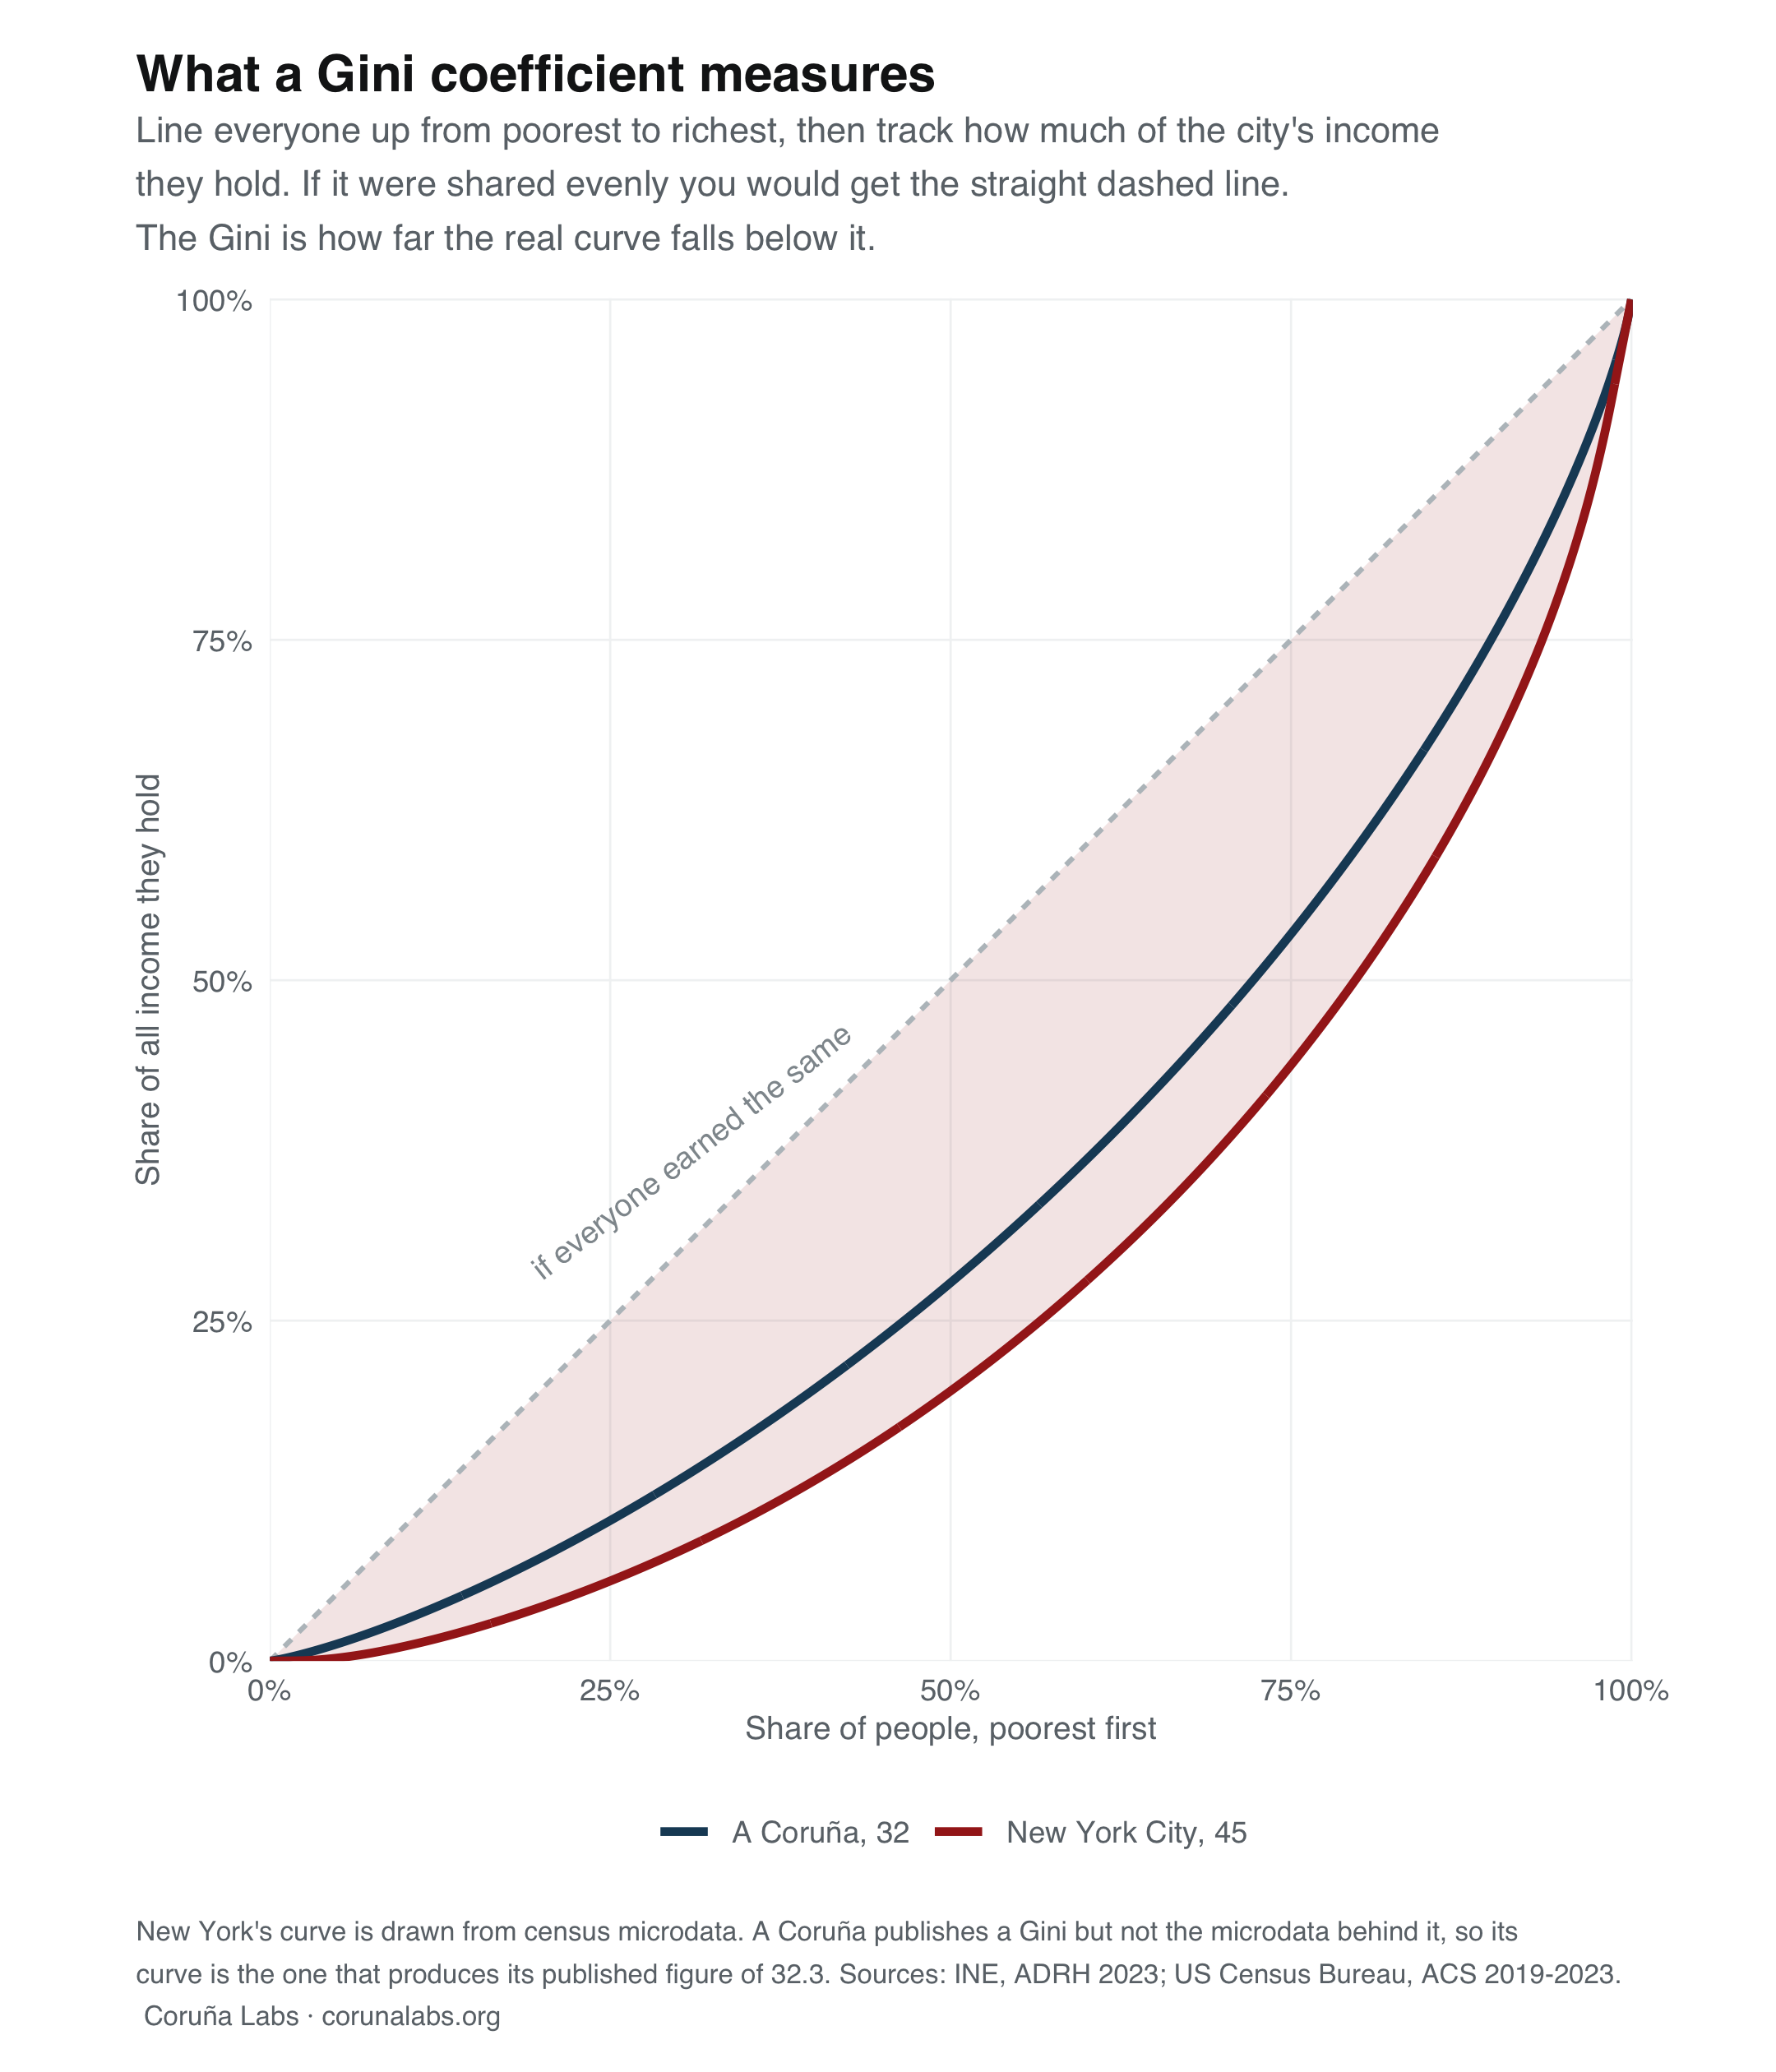
If you line everyone up from poorest to richest, then track how much of the total income each slice of the population holds, that spread is the Gini coefficient. In a city where everyone earned the same, the poorest 30% would hold 30% of the income, and you would get a straight line.
The Gini is how far the real curve falls below that straight line. Zero means everyone earns the same, and one hundred means a single household holds everything. A Coruña scores 32 and New York scores 45.
Making the two similar
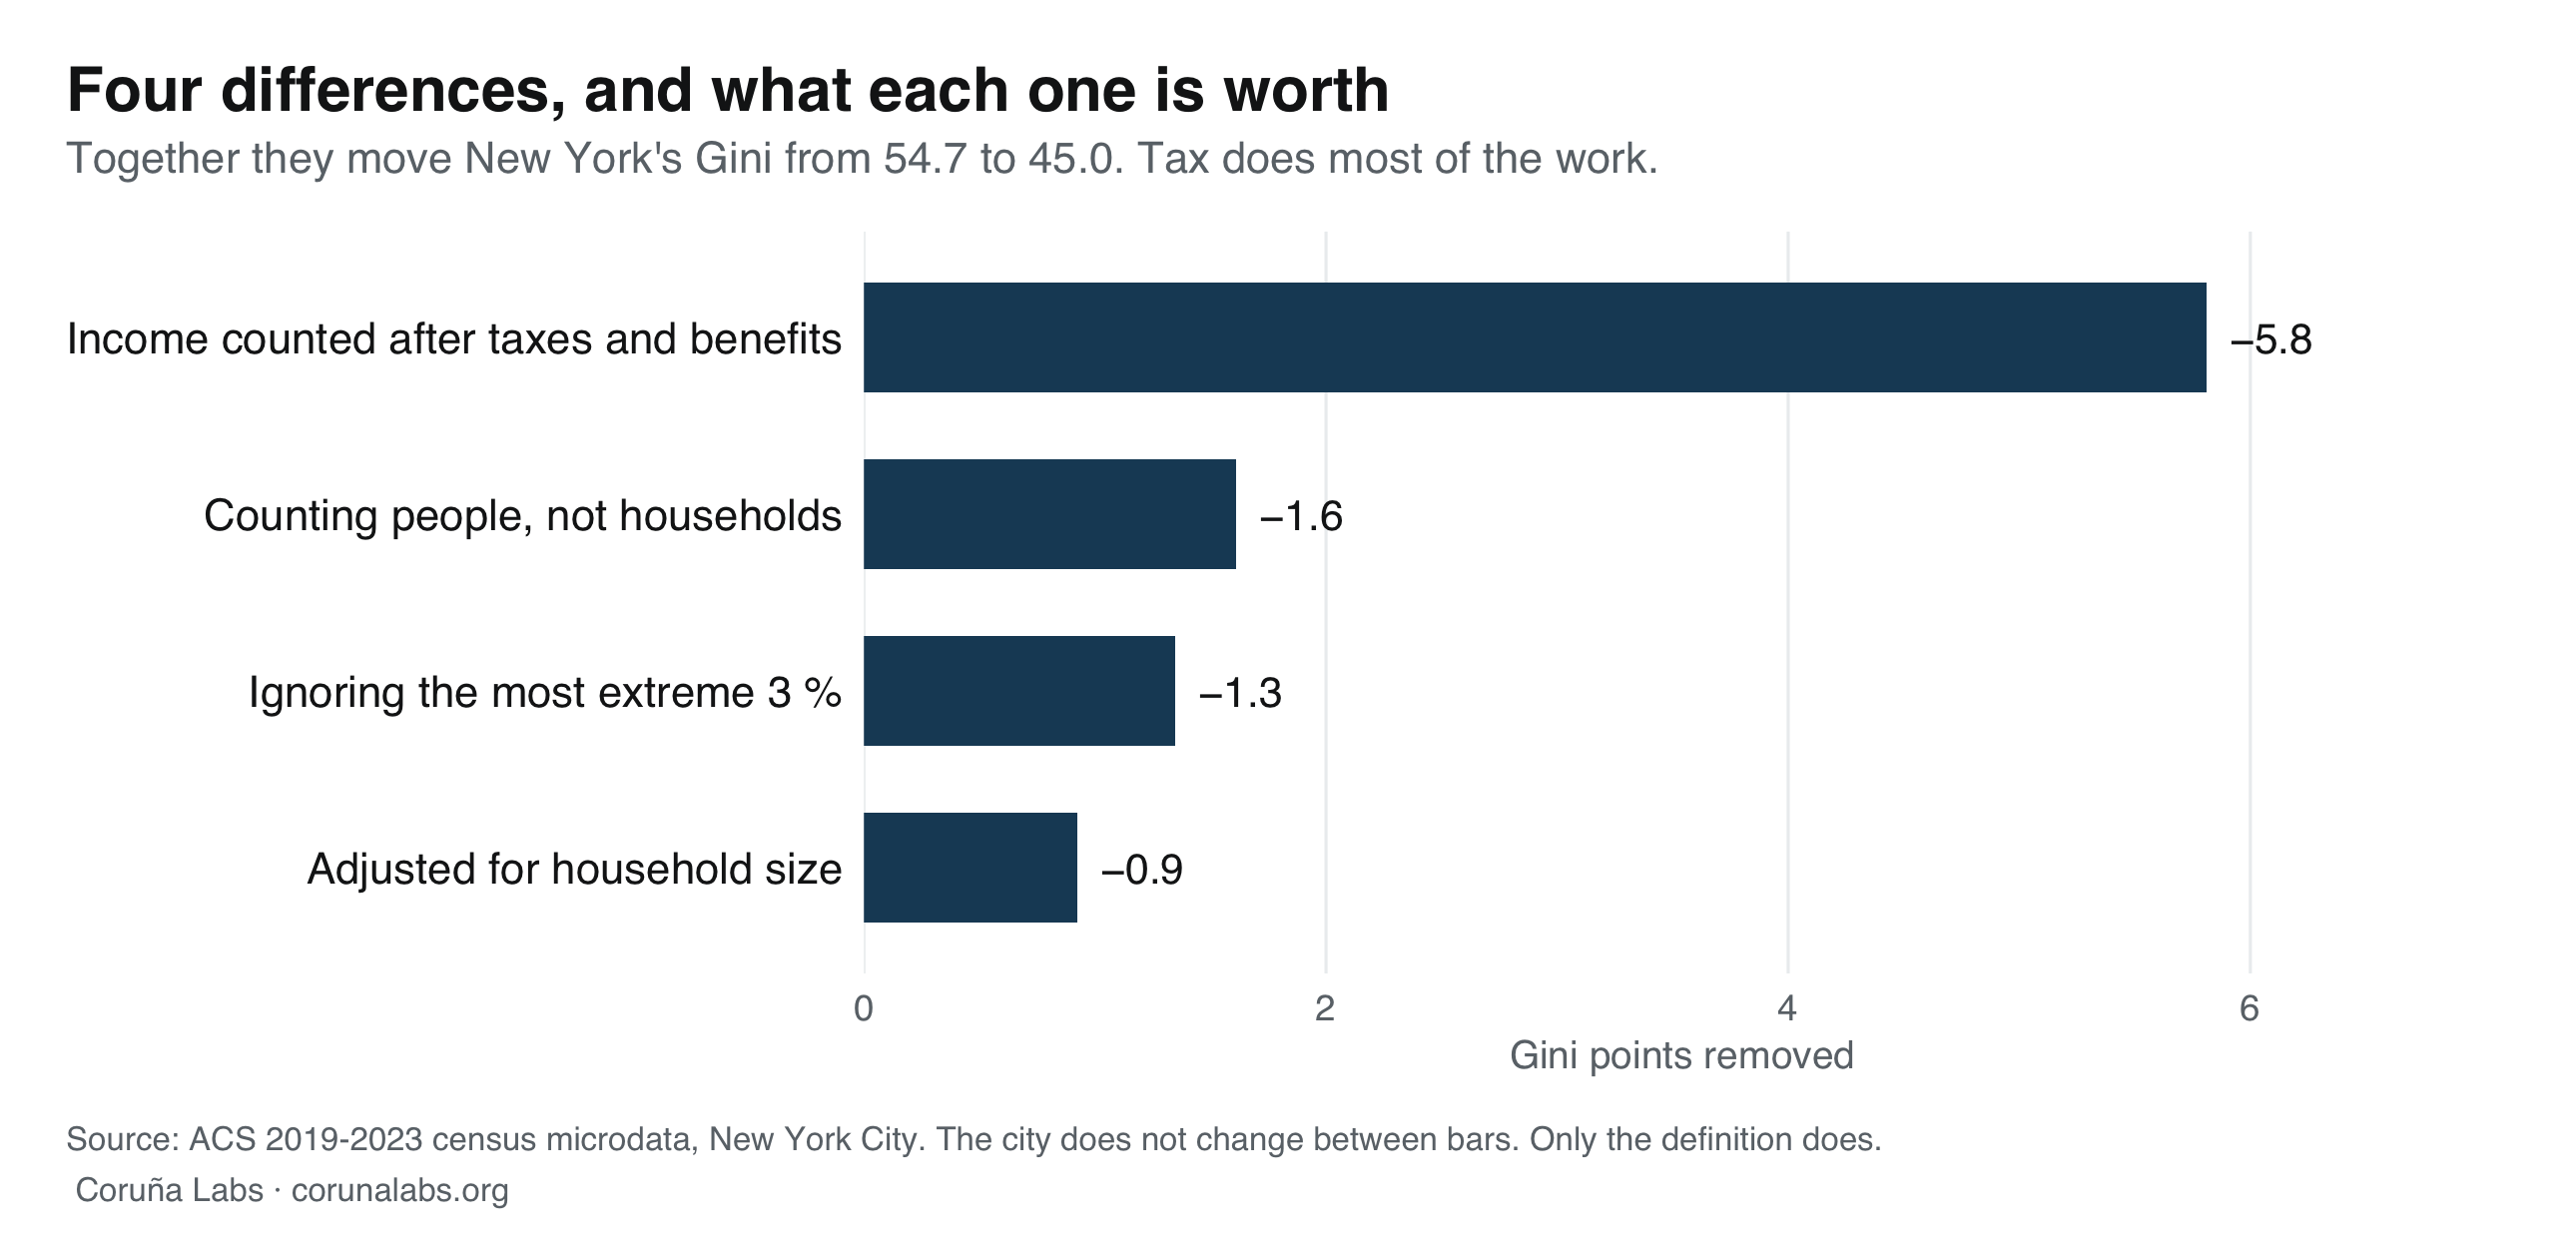
Spain measures income after tax, adjusted for household size (a couple isn’t twice as rich as one person, rent doesn’t double), counted per person, with the extreme ends trimmed. The American figure counts household income, before tax, with no adjustment and no trimming.
Every one of those four differences pushes New York’s number up. So closing the gap meant rebuilding Spain’s definition for New York from scratch, which meant writing a working model of the federal, state and city tax codes and running every household in New York through it.
This moves New York from 54.7 to 45.0.
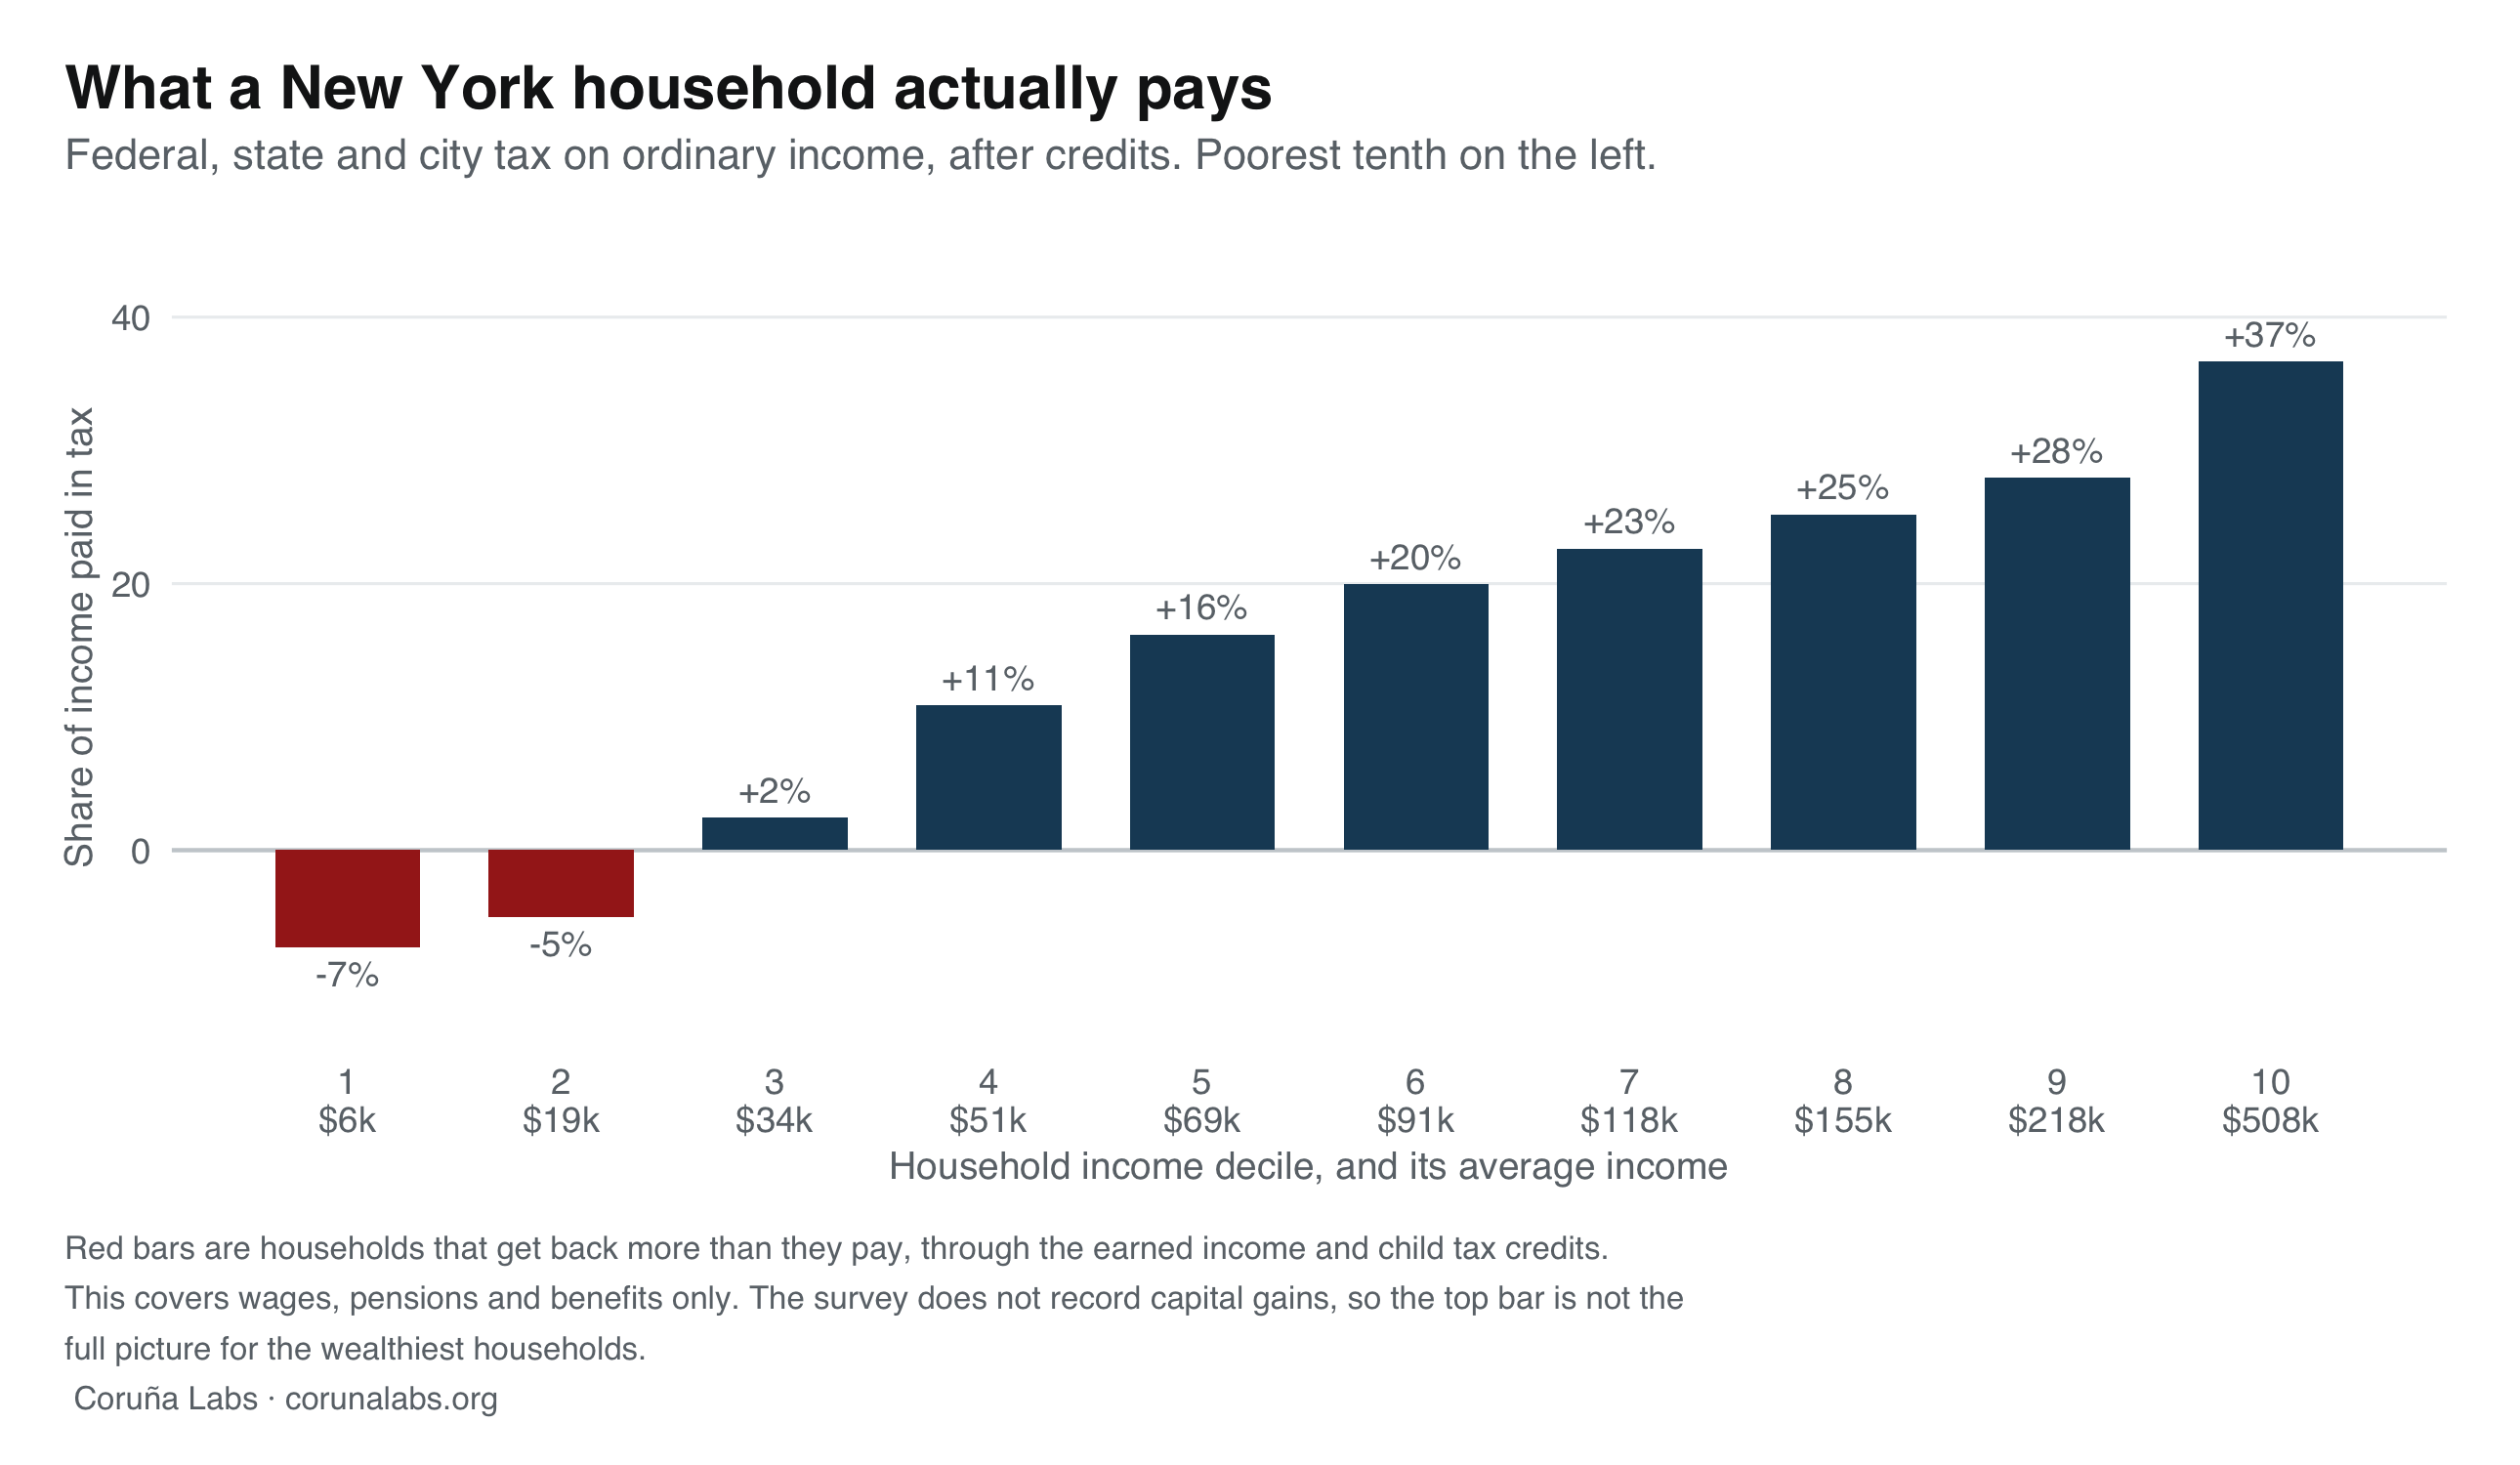
Tax is the big one, and it’s the easiest to describe. For every household in the city, run its income through the tax code and see what’s left:
net income = money income − income tax − payroll tax + refundable credits
Income tax means federal, New York State and New York City combined. Payroll tax is the share of Social Security and Medicare that comes out of a paycheck. Refundable credits are the earned income and child tax credits, which for low earners pay out more than the household owes.
Capital gains
One notable difference in the US is that they don’t account for “capital gains” the way Spain does.
The American Community Survey, the survey behind essentially every neighborhood income statistic in the United States, asks about wages, self-employment, interest, dividends, rent, Social Security, pensions and public assistance. It does not ask about capital gains. They’re excluded from the Census Bureau’s definition of “money income.”
Which means the largest source of income at the very top of the American distribution is missing from the statistic the US uses to measure its own inequality. (CBO, 2022)
The Internal Revenue Service, the United States’ agency responsible for collecting federal taxes, knows precisely what capital gains were realized and by whom. That file simply never meets the survey at the US Census Bureau. Spain gets it in one annual number because the tax authority hands the INE the data.
Practical implication: every US figure below is a floor. Given how wealth actually works in the US, the real number should be higher.
The end result
Every choropleth grades on a curve. The colors come from that city’s own minimum and maximum, so even a nearly perfectly equal city produces a nice gradient. It shows you where the local extremes are. It says nothing about whether “extreme” here means anything anywhere else.
So, hold A Coruña’s scale fixed, and drop it on New York. Then flip it back and watch what returns.
New York, read twice
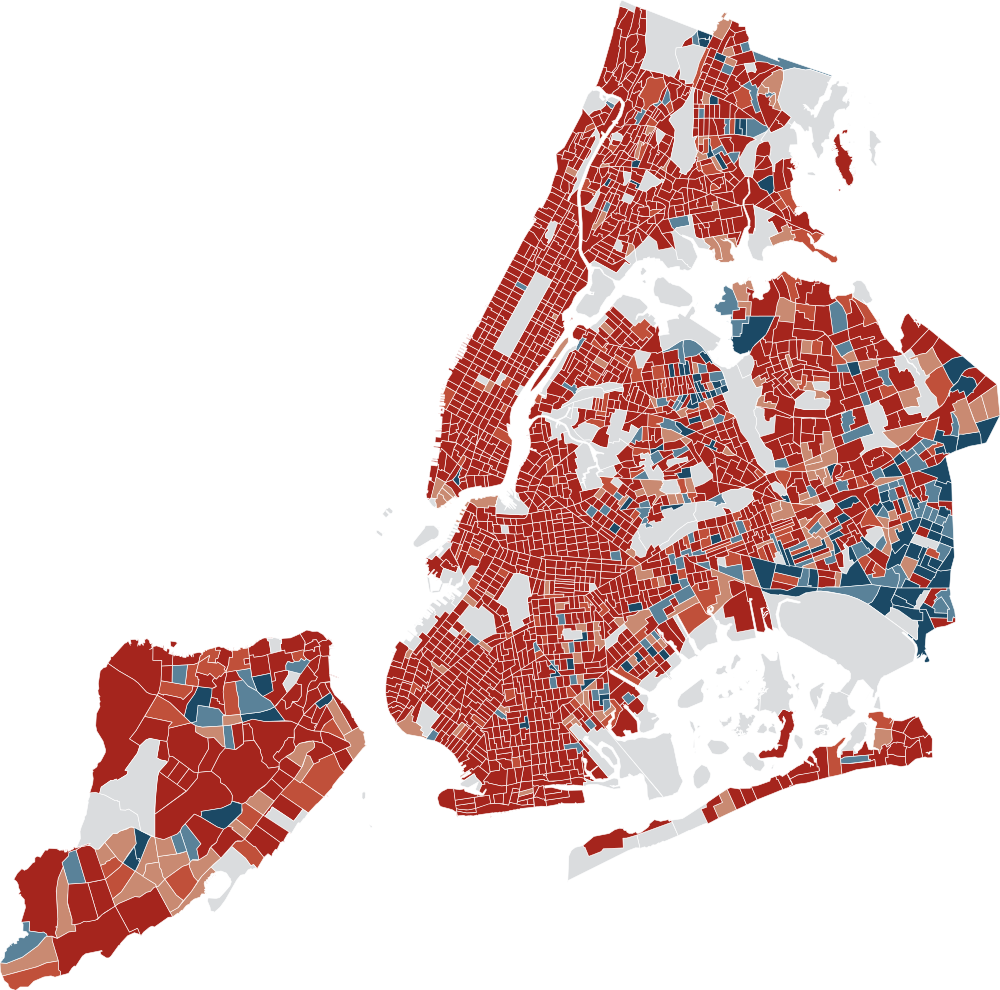
The same 2,208 census tracts, on Spain's income concept. Only the class breaks change.
- under 27.1
- 27.1–29.3
- 29.3–31.0
- 31.0–32.5
- 32.5 and over
- no data
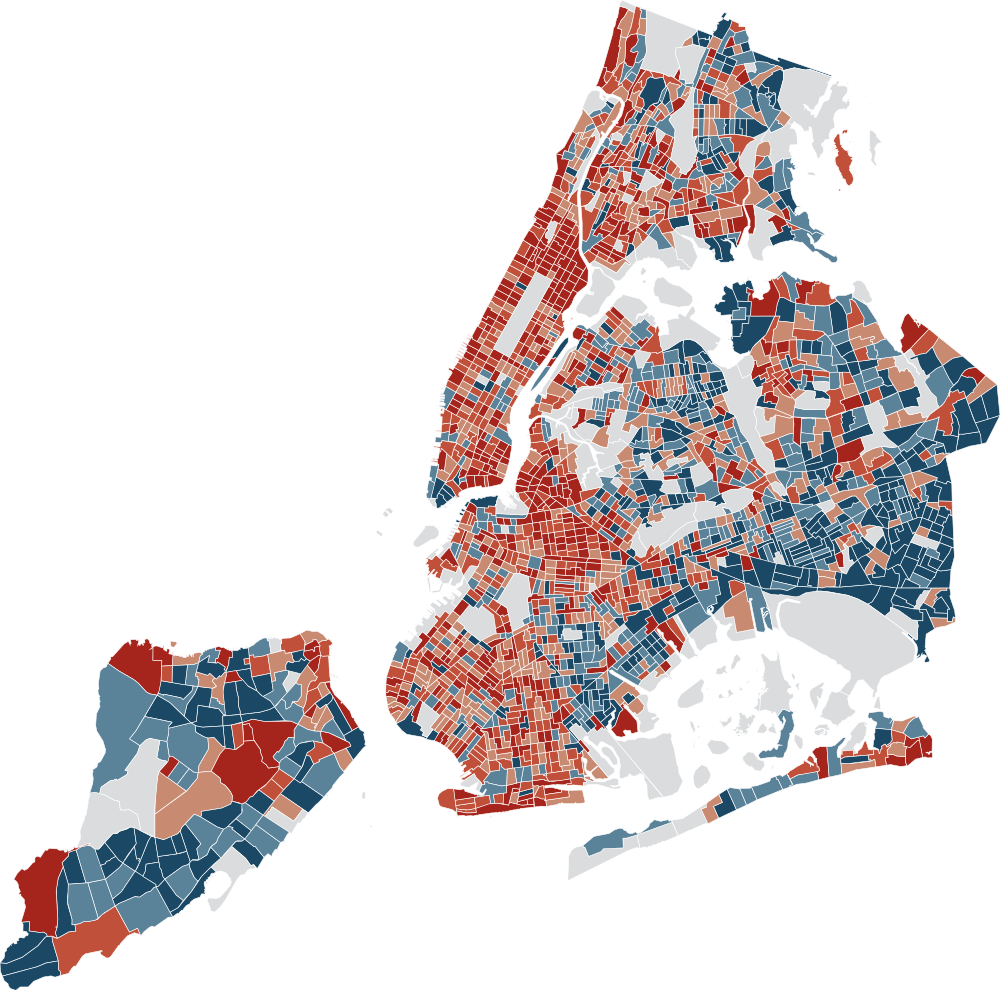
- under 31.4
- 31.4–34.7
- 34.7–37.7
- 37.7–41.4
- 41.4 and over
- no data
On A Coruña’s scale, the city is essentially one color. Three quarters of New York’s census tracts land in the top class, the band A Coruña reserves for its most unequal fifth. Switch to its own scale and the detail comes back, from the same tracts carrying the same numbers.
Run it backwards and A Coruña goes almost entirely blue.
A Coruña, read twice
The same 186 census sections, the same values. Only the class breaks change.
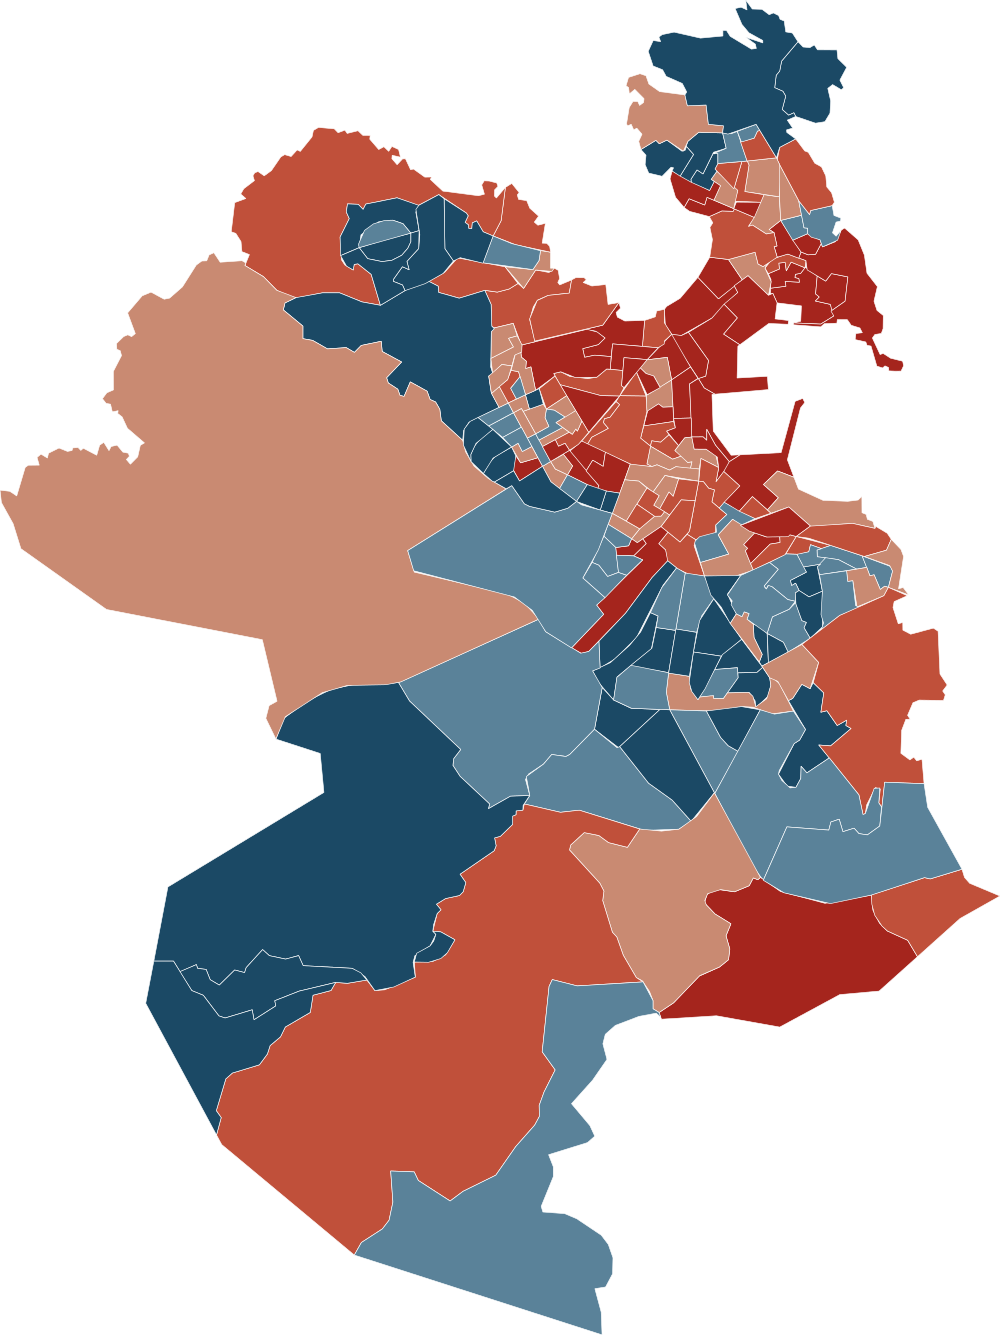
- under 27.1
- 27.1–29.3
- 29.3–31.0
- 31.0–32.5
- 32.5 and over
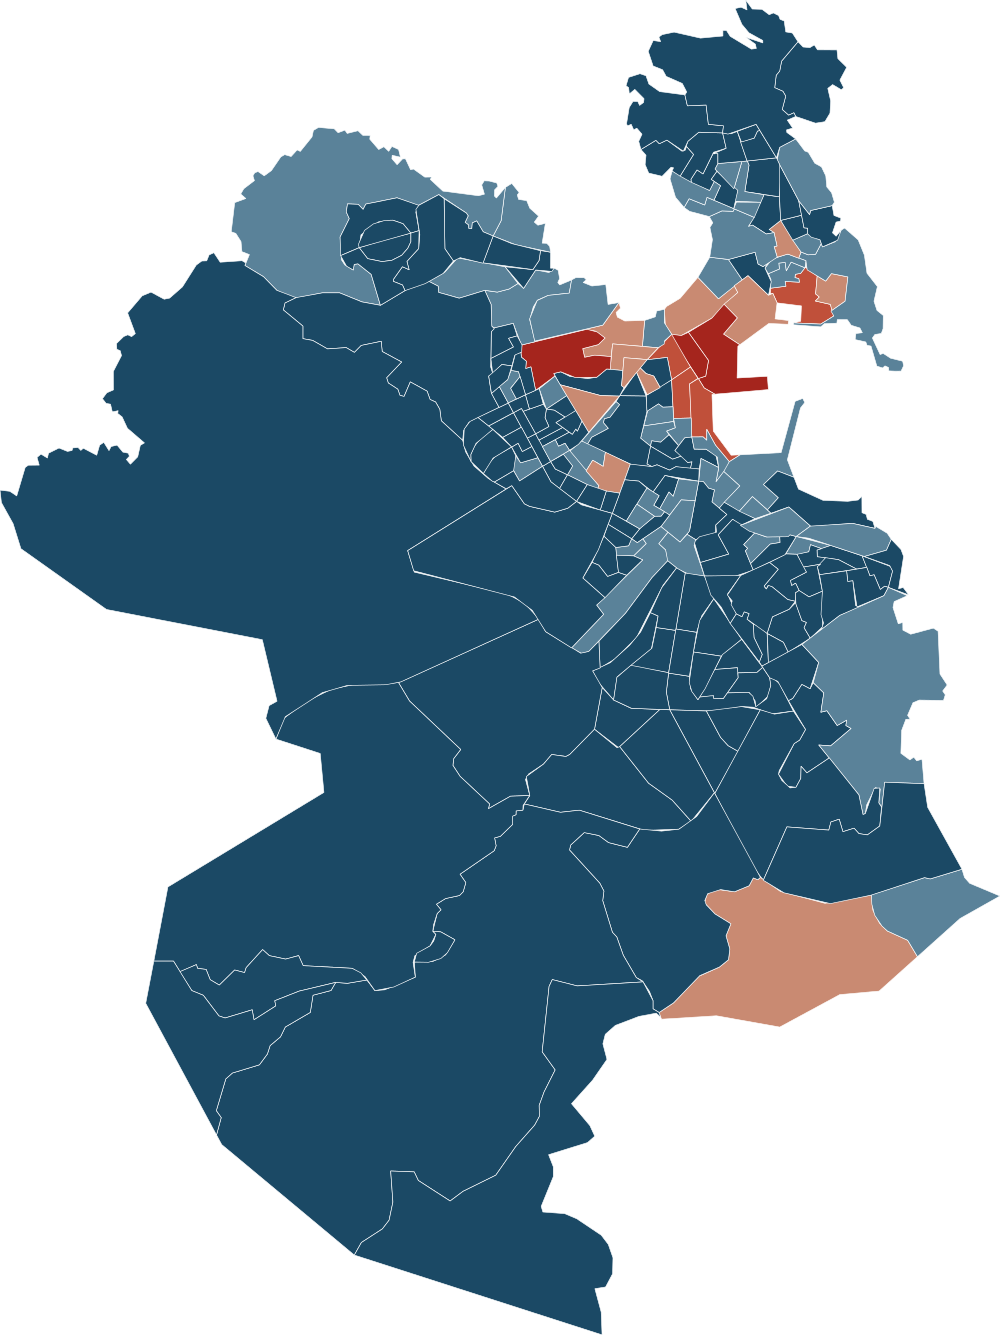
- under 31.4
- 31.4–34.7
- 34.7–37.7
- 37.7–41.4
- 41.4 and over
Inequality piles up in the dense, old, mixed center. On both maps the red sits in the long-settled core and thins toward the edges, which is the same pattern in Galicia as in New York, at the same grain.
New York might reflect a greater trend of more extreme inequality in the United States. This trend is more obscure given that what’s commonly known to be a source of wealth for the highest earners, capital gains, are not reflected in America’s survey data.
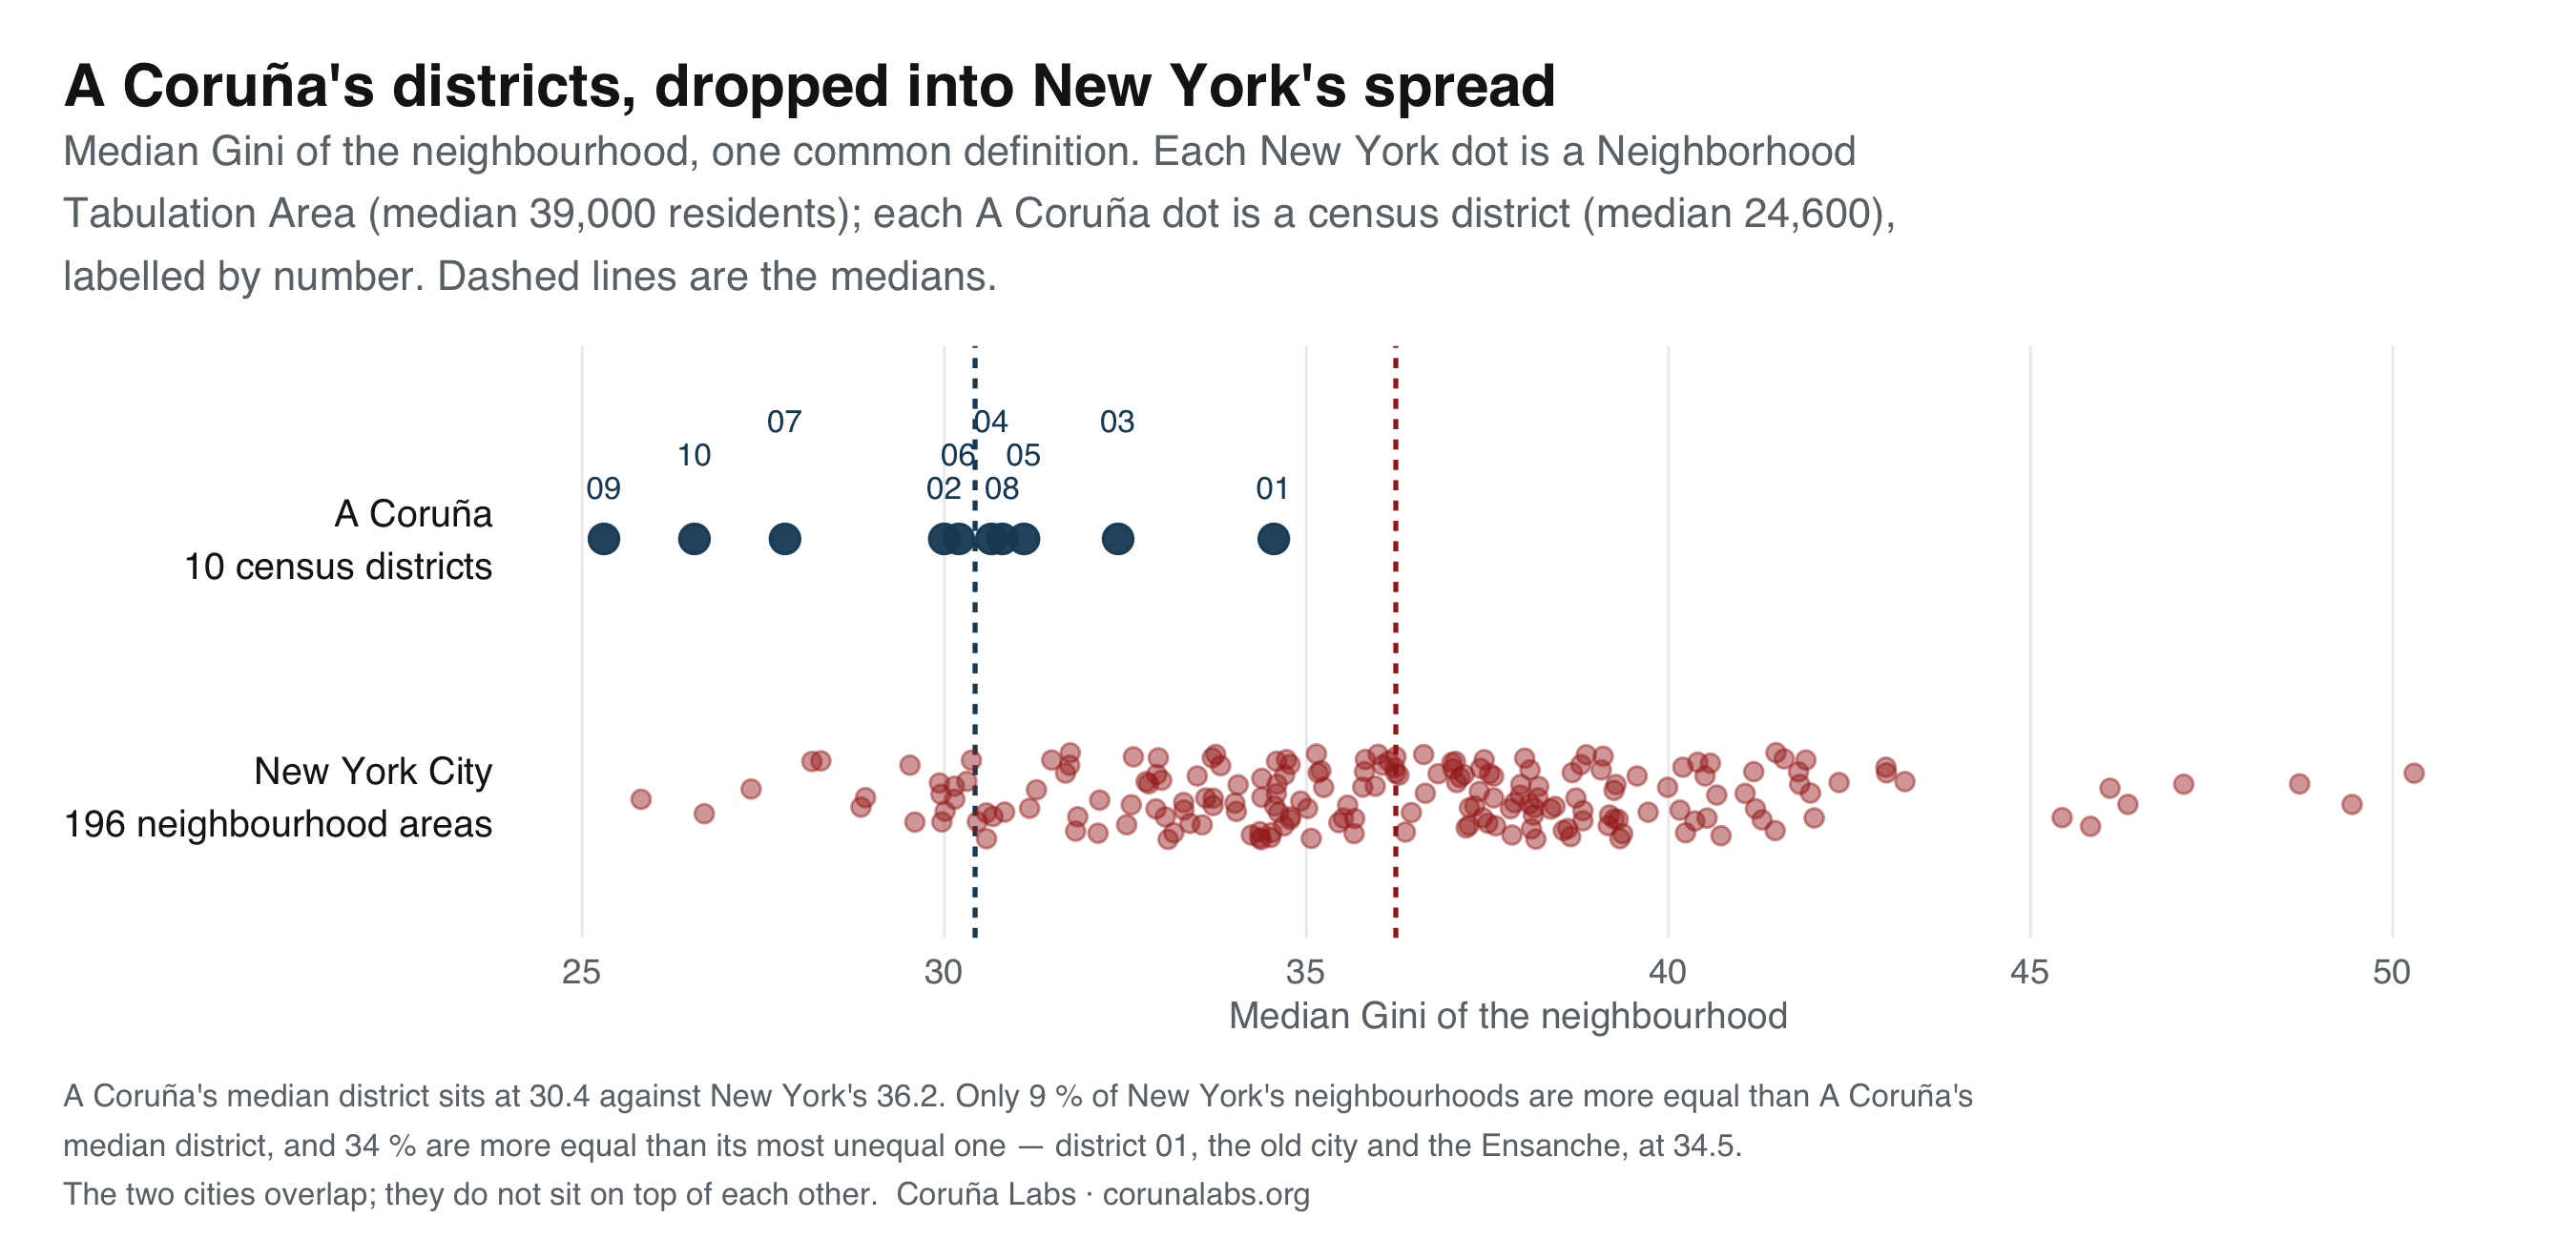
More practically, however, is the difference between these two cities isn’t that one has unequal neighborhoods and the other doesn’t. It’s how much of the city they take up.
Limitations
Scale. A Coruña has 245,000 people; New York has 8.8 million. Scale drives housing markets, segregation and social distance in ways no coefficient touches. My guess is Madrid and Barcelona would look more like New York here than like A Coruña, but that’s a guess, and it isn’t in this data.
Capital Gains. Until American capital gains reach neighborhood statistics, every US number here is a lower bound.
Spread and Context. Gini describes how stretched incomes are inside an area, and is entirely context dependent. Two neighborhoods, in different cities, can score identically and feel nothing alike.
Welfare. A Coruña’s taxes come back as childcare, university, healthcare, transit and a livable pension. New York’s mostly don’t. Equal-looking incomes in the two cities are not equal lives, and no amount of harmonizing can fix that.
Spanish data: INE, Atlas de Distribución de Renta de los Hogares, 2023. American data: US Census Bureau, ACS 2019–2023 and PUMS microdata. Method, sources and the full list of caveats are documented alongside the code.